
Understanding where mortgage and housing rates have been helps us get a better idea of where things might go. Use these interactive mortgage and housing rate charts, courtesy of Jared Robertson, Mortgage Loan Originator, to help you stay in the know!
Historical rates on 30-year fixed-rate mortgages
First up on the useful index of interactive mortgage and housing rate charts is a comparison of historical rates on 30-year fixed-rate mortgages since 1991.
Annual average rates were higher than Q3 of 2022’s 5.58 percent in 1991, when they were around 9.25 percent. By 2001, 30-year fixed mortgage rates were about 6.97 percent.
Ten years later in 2021, low rates were the norm at about 2.96 percent!
See the historical rates on 30-year fixed-rate mortgages chart here.
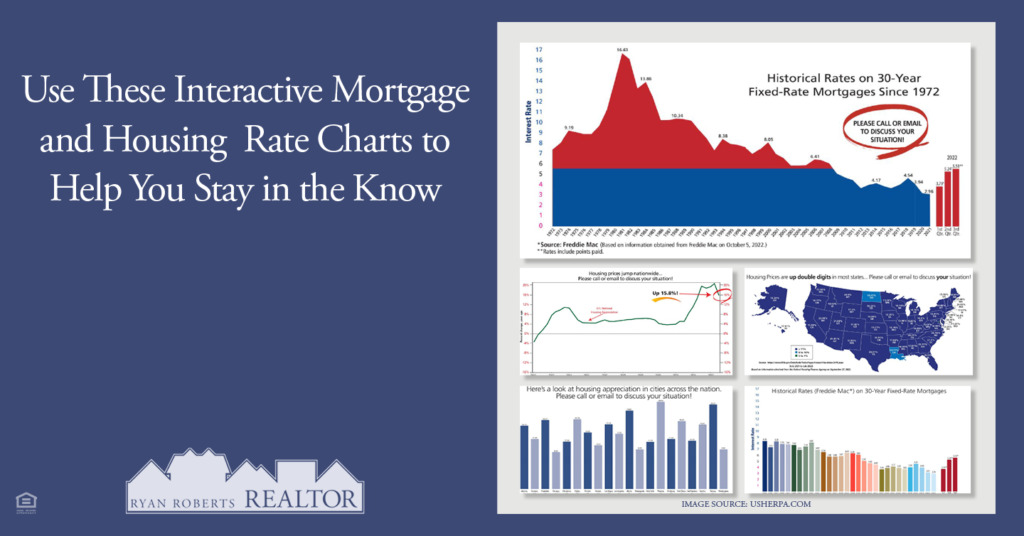
Historical rates on 30-year fixed-rate mortgages since 1972
If you thought the recent uptick in 30-year fixed mortgage rates was hair-raising, check out what was happening in 1981.
According to historical rates on this 30-year fixed mortgages since 1972 interactive chart, rates peaked at a whopping 16.63 percent!
See the historical rates on 30-year fixed-rate mortgages chart since 1972 here.
Home price index map
Did you know housing prices are up by double digits in most states across the country? Data collected from the Federal Housing Finance Agency illustrates just that!
According to this home price index map, Alabama home prices have increased by 17.8 percent from July 2021 to July 2022.
See the home price index map here.
Nationwide housing prices jump
While housing prices jump nationwide, this graph does offer a glimmer of hope.
According to September 2022 figures, the price jump is about 15.8 percent. In June 2022, however, that figure was about five percent higher at 20.4 percent.
See the home price indices chart here.
Housing appreciation in the last 36 months in the top 20 cities
Housing prices aren’t the only values going up. Homeowners are also seeing an increase in property values, also referred to as housing appreciation.
Check out housing appreciation in the last 36 months in the top 20 cities for an overview of where values are jumping the most.
See the housing appreciation in the last 36 months in the top 20 cities chart here.
Summary
Although these interactive mortgage and housing rate charts help paint a broad picture of what’s happening in the housing market, it’s always a good idea to connect with an expert. If you are looking to discuss mortgage rates and options, check out a list of local lenders on our Helpful Contacts page. For more industry news, trends and local spotlights, keep reading our blogs.